
THE U.S. GOVERNMENT HAS BEEN BUILDING HOMEOWNER WEALTH SINCE 1938 - ARE YOU IN?
This has nothing to do with Trump or Biden. This is a structural policy that has survived every administration for over 80 years - and it's quietly working in favor of millions of American homeowners.
This has nothing to do with Trump or Biden. This is a structural policy that has survived every administration for over 80 years - and it's quietly working in favor of millions of American homeowners.
START WITH A QUIZ
Quick question: What percentage of American households own the home they live in?
Most people I ask guess somewhere between 20% and 40%. Almost nobody guesses the real answer.
Almost nobody.
It's 65.6%. Nearly two-thirds of American households are homeowners.
Why does almost everyone guess wrong? Because we've internalized a belief that most Americans can't save, can't afford a home, and are one bad month away from financial trouble. The headlines reinforce it.
But the data tells a different story - and understanding that story changes how you think about long-term investing.
My goal with this post is simple: to show you why betting on long-term home value appreciation isn't a bold move. It's actually one of the more conservative long term bets you can make.
THE WEALTH PLAN MOST AMERICANS DON'T KNOW THEY HAVE
For most homeowner households, the home isn't just an asset - it's essentially the asset. According to Federal Reserve data, home equity represents roughly 60-80% of net worth for middle-class American families. Retirement accounts come in second, but with a median 401(k) balance of just $38,176 (Vanguard, 2024), they're not carrying the load.
Stocks and investment accounts? Largely concentrated at the top. The top 10% of households own approximately 87% of all stocks and mutual funds.
So for the vast majority of American families, real estate is the wealth plan. Not a part of it - the whole thing.
And here's where it gets interesting.
A PRODUCT THAT ONLY EXISTS IN AMERICA
The 30-year fixed-rate mortgage is, in most of the world, a strange and exotic financial instrument.
In Canada, the UK, Australia, and most of Europe, mortgages reset every 2-5 years at whatever the market rate happens to be. If rates go up, your payment goes up. You carry the risk.
In the United States, you can lock in a rate for 30 years. If rates drop, you refinance and capture the savings. If rates rise, you're protected.
This is one of the most borrower-friendly financial products ever created. And the reason it exists is not because banks love you - it's because the U.S. government built the infrastructure to make it possible:
1938: Fannie Mae is created by the U.S. government to buy mortgages from lenders so they can issue more.
1970: Freddie Mac is created to expand the same function.
FHA and VA loans further extend access with low or zero down payment options.
These agencies purchase and guarantee trillions of dollars in mortgages. Without them, no private lender would hold a 30-year fixed-rate loan on their books. The government essentially said: we'll absorb that risk, so that ordinary Americans can own homes and build wealth.
THINK LIKE AN INVESTOR: THE GDP ENGINE
Here's the mechanic that separates homeowners who get it from those who just got lucky.
When you buy a home with a 30-year fixed mortgage, three things happen over time:
The value of your property grows - historically at ~3.92% per year on average, closely tracking U.S. GDP growth (as I covered in detail in The 3.92% Gold Standard)
Rents grow - historically at roughly 80% of the appreciation rate, year after year
Your mortgage payment stays exactly the same - locked in nominal dollars, on day one
As the U.S. economy produces more value, that wealth flows into property values and rents. Your income grows. Your asset grows. Your debt payment does not.
This is the investor's edge hiding inside a standard homeowner's mortgage. The gap between rising rents and a flat mortgage payment is where cash flow is born. The gap between rising property value and a flat loan balance is where equity is built.
And because the 30-year fixed exists, you can also access that equity through a cash-out refinance - tax-free, without selling the asset. I cover the full tax picture in this post, but the short version is: you can pull out your equity in today's dollars while the property keeps appreciating - a powerful move that most people never consider.
WHY THE SYSTEM IS DESIGNED TO SUPPORT YOU
Here's what I believe - and the data supports it:
The U.S. government has a structural, bipartisan, multi-decade incentive to keep home values stable and growing.
The logic is simple: if 65% of American households hold most of their net worth in home equity, then a collapse in home values is a collapse in middle-class wealth. No administration wants that on their watch.
Think about it - no U.S. government in the last 100 years has let the housing market fall and stay down. Not through the Great Depression. Not through the 2008 financial crisis. Not through a global pandemic. Every single time, the policy response was the same: protect the housing market.
So the infrastructure - Fannie, Freddie, FHA, the mortgage interest deduction - keeps getting maintained, expanded, and protected across party lines.
The result? U.S. home prices have increased year-over-year in 63 of the last 70 years (90% of the time). The 20-year rolling average appreciation is 3.92% - consistent across good economies and bad. Even the worst 20-year period (1993-2012, which included the 2008 crash) still delivered +2.92% per year.
That's not luck. That's a system working as designed.
YOU DON'T HAVE TO LIVE THERE TO GET ON THE SCOREBOARD
Here's the angle most people miss entirely.
A lot of people tell me: "I'd love to own, but I'm not ready to commit to a location - my job might move, my family situation might change". That's a real and valid concern. But it doesn't mean you have to sit on the sidelines.
You can own as a landlord even if you're renting where you live.
Think about it this way: if you need flexibility in your personal life, you rent where you need to be. But at the same time, you buy an investment property somewhere the numbers work - and your tenant's rent covers the mortgage, the expenses, and ideally generates some cash flow on top.
You stay nimble personally. You stay on the scoreboard as an investor. Your tenant funds your equity while you use your own income to cover your rent. Over time, the property appreciates, the mortgage gets paid down, and you've built real wealth - without ever being "locked in."
This is exactly the long-term investor mindset: you don't need to live in the asset to benefit from the system.
THE BOTTOM LINE
The U.S. government made a structural decision, starting in 1938, to make homeownership the primary wealth-building vehicle for the American middle class - and then built the policy infrastructure to back it up. That decision has been reaffirmed by every administration since, through every economic cycle.
Two-thirds of American households are already benefiting from this system, whether they understand it or not. Their net worth is growing - slowly, structurally, powered by machinery that has survived the Great Depression, World War II, the 2008 financial crisis, and a global pandemic.
Most people think of real estate as a risky, illiquid bet. I'd argue the opposite: with 87 years of policy infrastructure behind it, betting on long-term home value appreciation is one of the most structurally supported, historically consistent bets available to an ordinary investor.
The risk isn't in getting in. For most people, the risk is in waiting too long.
The only question is whether you're in.
Disclaimer: I'm a fellow investor and self-learner, not a financial or legal advisor. This is based on my personal research and experience. Always consult with qualified professionals before making investment decisions.
Sources:
U.S. Homeownership Rate: https://fred.stlouisfed.org/series/RHORUSQ156N
Federal Reserve Survey of Consumer Finances (household wealth composition): https://www.federalreserve.gov/publications/files/scf23.pdf
Stock ownership concentration - Federal Reserve Distributional Financial Accounts: https://www.federalreserve.gov/releases/z1/dataviz/dfa/distribute/chart/
Fannie Mae history: https://www.fanniemae.com/about-us/who-we-are/history
U.S. Housing Price Index: https://fred.stlouisfed.org/series/USSTHPI
Median 401(k) balance - Vanguard "How America Saves" Report: https://corporate.vanguard.com/content/dam/corp/research/pdf/how_america_saves_report_2025.pdf
Want to talk through what this means for your situation?
I write these posts because I believe the more you understand the mechanics, the better decisions you make. If something here sparked a question - or made you wonder whether now might be the right time to start - I'm happy to think through it with you.
Or reach out directly: yossi@mylongterm.com | WhatsApp: +1 (650) 658-1010
WHAT IF YOUR RENTAL FELT LIKE HOME?
For too long, renting and belonging have felt like opposites. We think that's a design problem - and we designed a fix.
FOR TOO MANY, RENTING AND BELONGING HAVE FELT LIKE THE OPPOSITES. WE THINKING THAT’S A DESIGN PROBLEM - AND WE DESIGNED A FIX.
I know the feeling well. You find a house you love - good schools nearby, a neighborhood that feels right, a yard where you can picture your kids growing up. You sign a one-year lease, you unpack, you start to settle in. And then, almost immediately, a quiet anxiety sets in.
What happens next year?
Will the landlord raise the rent beyond what I can afford? Will they decide to sell? Will this place that I'm starting to love suddenly stop being mine? You don't hang the pictures quite the way you would if this were your home. You don't plant the garden you've been imagining. You hold back - emotionally, financially, practically - because you know this could all end in twelve months.
That hesitation is rational. But it's also a tragedy. Because millions of people are living half-lives in perfectly good homes, never fully arriving, because the system was never designed for them to stay.
THE LANDLORD’S QUIET PROBLEM
Now flip the lens. You're a landlord - or at least, that's what the paperwork says. But really, you're an investor with a long horizon. You bought this property not to flip it next year, but to hold it for a decade or two, let it appreciate, and build something real over time.
What you want more than anything is a good tenant who stays. Someone who treats the place with care, pays on time, and doesn't require you to spend every autumn renegotiating, re-listing, and hoping. Vacancy is expensive. Turnover is exhausting. And every time you raise the rent to keep pace with the market, you risk losing the very tenant you worked so hard to find.
The traditional lease pits landlord and tenant against each other - when actually, their long-term interests are almost perfectly aligned.
One month of vacancy can erase an entire year's worth of rent increases. Yet the system pushes landlords to maximize rent annually, which destabilizes the relationship that makes long-term ownership sustainable in the first place. It's a design flaw masquerading as standard practice.
A LEASE DESIGNED FOR TRUST, NOT TRANSACTIONS
At myLongTerm, we build solutions for people who think in decades, not quarters. And one of the things we've thought hardest about is: what would a lease look like if it were designed to actually work for both sides over the long run?
Here's what I came up with - a structure I've now seen working in practice, with real landlords and real tenants building real long-term relationships.
THE LONG-TERM LEASE FRAMEWORK
Start with a standard one-year lease
The first year is a trial - a chance for both sides to build trust. The tenant proves they're the kind of person who treats someone else's investment like their own home. The landlord proves they're the kind of owner worth staying for.
Year two: a fixed 2.5% annual increase, forever
If the tenant earns it - by meeting lease requirements and passing an annual inspection - they're offered a long-term lease with a fixed 2.5% annual rent increase. No surprises. No negotiations. No anxiety every autumn. Below average inflation, and entirely predictable.
The tenant can always leave - with 60 days' notice
This isn't a trap. There's no multi-year commitment the tenant is locked into. They can go whenever life takes them somewhere else. The security comes not from obligation, but from trust - and from knowing they could stay as long as they want.
The landlord can show the property with 24 hours' notice
If the time ever comes to transition, the landlord can market and show the home without blind-siding the tenant. Vacancy risk is dramatically reduced. The process stays respectful.
The landlord can only ask a tenant to leave in three situations
The tenant violates the lease terms. The landlord decides to sell the property. The landlord decides to move in themselves. The second and third scenarios requires 60 days' notice, and are genuinely rare - but naming them explicitly is what makes the whole thing feel safe.
What does this create? A home. Not legally - it's still a rental. But emotionally, practically, psychologically: a place the tenant can plant roots in, decorate with intention, and care for the way people care for things that are truly theirs.
WHAT EACH SIDE ACTUALLY GAINS
FOR THE RENTER
Predictable costs - you know exactly what you'll pay years from now
Real stability - stay as long as you want, on your terms
Freedom to invest in your space, emotionally and practically
No annual negotiation anxiety
A home that happens to be a rental
FOR THE OWNER
Long-term tenants who treat the property with care
Dramatically reduced vacancy and turnover costs
No annual re-listing, showing, or screening
Predictable income with built-in growth
Peace of mind - the rarest asset in real estate
Yes, the landlord may grow rent slightly below market in a hot year. That's the trade - and it's a good one. One month of vacancy costs more than a year of "below-market" rent. And the tenant who stays for seven years, pays on time, and sends you a thank-you card at the holidays? That's not something you can price.
A DIFFERENT WAY TO THINK ABOUT OWNING AND RENTING
Here's something I've noticed among the people I work with at myLongTerm: many of them are both renters and owners at the same time.
They rent where they want to live - close to family, in a city they love, somewhere that fits their life right now - and they own where it makes long-term financial sense. They're not trying to own their home. They're trying to build wealth and live well simultaneously.
This idea used to feel radical. It doesn't anymore. A new generation of people understands that ownership and belonging don't have to happen in the same place. You can rent a home you love, in a neighborhood that suits you, while your investment property in another city quietly appreciates and generates income. The key is having a rental that actually lets you settle in - rather than one that keeps you perpetually on edge.
People are more likely to rent well, and live well, when they know the ground beneath them isn't about to shift.
That's what this lease is really about. Not a legal document. A foundation.
DESIGNING FOR THE LONG TERM
At myLongTerm, we help people build long-term wealth through real estate - but we've always believed that the human side of the equation matters as much as the financial one. The best investment property isn't necessarily the one in the hottest market. It's the one with a great tenant, a stable relationship, and a structure that lets both sides thrive for years.
The lease framework above is one of several solutions I've developed with that philosophy in mind. I've seen it work. I've watched landlords breathe easier and tenants finally hang their pictures without hesitation. And I believe more of the world should have access to it.
Because when you design for the long term, more people benefit. That's not a coincidence. That's the whole point. ❤️
Want to talk through what this means for your situation?
I write these posts because I believe the more you understand the mechanics, the better decisions you make. If something here sparked a question - or made you wonder whether now might be the right time to start - I'm happy to think through it with you.
The intro call is free, 20 minutes, and there's no pitch. Just a conversation.
Or reach out directly: yossi@mylongterm.com | WhatsApp: +1 (650) 658-1010
DOES RENT ALWAYS GO UP? WHAT 45 YEARS OF DATA TELLS US
There's one dataset I think every residential real estate investor should be familiar with: historical rent values.
Looking at the data, you'll find that in the past 45+ years, rent has gone up year-over-year - every single year, without exception.
I was genuinely surprised when I first discovered this, because I know for a fact that house prices don't always go up year-over-year. And I also know rent prices generally correlate with house prices. So... what's going on?
One of the datasets I think every residential real estate investor should be familiar with is the US historical rent values. If you want to dig into it yourself, check it out here: BLS Survey Output
It's collected by the US Bureau of Labor, and it's based on a sample survey - meaning people reporting on their own rental expenses. So it's not super accurate (unlike the House Price Index, which is based on detailed recordings of every transaction). And because the data is more sparse, we only have it at the US country level - no state, county, or city breakdowns. But it's the best we have. And it's fascinating.
RENT HAS GONE UP EVERY SINGLE YEAR SINCE 1980
If you filter that BLS report from 1980 to today, you'll find that in the past 45+ years, rent has gone up year-over-year - every single year, without exception.

Comparing US Rent Price Index (https://data.bls.gov/timeseries/CUUR0000SEHA) and US House Price Index (https://fred.stlouisfed.org/series/USSTHPI) - both YoY value incfrease (thin lines) and 20yr window ROI (think lines) between 1980 and 2025
(Worth noting: the data actually goes back further, and if anything, the rent growth trend was even stronger in the decades before 1980. I chose to focus on 1980 onward since that's the house price data window I'm working with - and frankly, these are the years our generation actually lived through)
I was genuinely surprised when I first discovered this, because I know for a fact that house prices don't always go up year-over-year (you can see that data here). And I also know rent prices generally correlate with house prices. So... what's going on?
One more lens worth looking at before we dig in: if you zoom out to a 20-year rolling window (also shown in the graph), both rent and house prices are always positive - no exceptions. House prices actually grow faster over the long run, with rent coming in at roughly 85-88% of that growth rate. But here's the flip side: rent is far more stable year-to-year, as you can see from the smoother line. For a long-term investor, both data points tell the same story - time is your friend.
WHAT HAPPENED DURING THE 2007-2012 CRISIS?
I decided to take a closer look at the last major house price crisis we've seen - the subprime mortgage crisis that played out between 2007 and 2012.
When you look at the nationwide data during those years, you can see that between Q1 2007 and Q1 2012, the average US house price dropped from a CPI of 380.26 to 309.52 - a 19% decline. And that's the national average. Specific areas were hit way harder: Nevada saw a 55% drop, California around 40%. Some states held up much better - Tennessee only dropped about 6%, which is actually one of the main reasons I was drawn to investing there in 2017.
But here's what blew my mind: during that same period, the nationwide average rent went up every single year. It climbed from a rent price index of 230.8 in January 2007 to 257.5 in January 2012 - an 11.6% increase - while house prices were cratering.

Comparing US Rent Price Index (https://data.bls.gov/timeseries/CUUR0000SEHA) and US House Price Index (https://fred.stlouisfed.org/series/USSTHPI) Year over Year Growth data between 2006 and 2015, including the through the 2008-2009 financial crisis.
So how do you explain that? Here's my take:
When the crisis hit, many homeowners found themselves owing more on their mortgage than their house was actually worth. A homeowner in Las Vegas watching their home value drop 55% while still carrying the full loan balance - it just didn't make financial sense to keep paying. So a lot of people handed the keys back to the bank and walked away.
That created two things at once:
Banks ended up owning a ton of houses. But they're not professional real estate investors - they don't know how to sell quickly. And they were smart enough to realize that dumping everything on the market at once would tank values even further. So they sold slowly, dripping inventory back into the market over time.
All those former homeowners still needed somewhere to live. They became renters.
So inventory went down while rental demand went up - and rent prices kept climbing, even during one of the worst financial crises in modern history.
WHAT ARE THE TAKEAWAYS?
Your cash flow should get better over time
When you own a rental property, you've got a lot of ongoing expenses - mortgage, taxes, insurance, maintenance, property management. But the mortgage (principal and interest) is by far the biggest one, usually around 75% of your monthly costs. And here's the thing: on a fixed-rate mortgage, that number never changes.
Your income, on the other hand, is rent - which, as we've just established, tends to go up over time. So your biggest expense is fixed while your main income source grows. That should naturally lead to improving returns the longer you hold.
If prices drop and you can afford to wait - don't sell
I know it's hard to stay calm when your asset value is declining. But year/year drops in real estate value are actually pretty rare - the US house price index had a year/year drop only 7 times in the past 70 years. And when it does happen, your rental income keeps coming in while you wait for the market to recover.
That's the key difference between a distressed homeowner and a prepared investor. The homeowner was stuck paying a mortgage on a property worth far less than the debt, with no income to offset it. The investor can take a breath, keep covering expenses with steady rental income, and wait for the market to correct - because it always has.
Markets fluctuate. Rent grows. The short term is noisy - the long term tells a very different story.
Want to talk through what this means for your situation?
I write these posts because I believe the more you understand the mechanics, the better decisions you make. If something here sparked a question - or made you wonder whether now might be the right time to start - I'm happy to think through it with you.
The intro call is free, 20 minutes, and there's no pitch. Just a conversation.
Or reach out directly: yossi@mylongterm.com | WhatsApp: +1 (650) 658-1010
LONG-TERM REAL ESTATE INVESTING: THESE AREN’T TAX TRICKS - JUST POWERFUL TOOLS ANYONE CAN USE
Most of us hear “tax advantages” and assume it’s complicated, risky, or reserved for experts.
In reality, some of the most powerful tax benefits in real estate are built into the system - and available to anyone willing to take a long-term approach.
Ever wonder why long-term real estate investors rarely sell their best properties? It’s not just about appreciation - the tax system heavily rewards holding over time.
A walkthrough of a simple 20-year investment and show how:
rental income can be sheltered
equity can be accessed without triggering taxes
and taxes can be deferred (or even avoided) over time
These aren’t tax tricks - just tools that long-term investors use.
Disclaimer: I'm a fellow investor and self-learner, not a tax expert, CPA, financial or legal advisor. This is based on my personal experience.
Tl;DR - HOW THIS ACTUALLY WORKS
As a homeowner, you can generate income, access cash when needed, and build long-term wealth - all while deferring or even avoiding taxes.
It comes down to a few simple ideas:
depreciation can offset taxes for your rental income
refinancing lets you access your equity without a taxable event
a 1031 exchange can defer taxes when you sell
and over the very long term, a step-up in basis can eliminate them entirely
When people hear “tax advantages” it often sounds like something complex, risky, or reserved for experts.
In reality, many of the most powerful tax benefits in real estate are built into the system - and available to anyone willing to take a long-term approach.
So, after our last look showed that a long-term real estate investment delivered a 9.62% annual Internal Rate of Return (IRR) over 20 years, let's dive into the tax side of that exact same investment.
My Investment Snapshot
Imagine a rental house I held onto for two decades. Based on the scenario I used in a previous blog post - Initially buying a property for $500,000, and assuming a modest annual appreciation of 3.68% (just under the 20-year national average of 3.92%), this same house is expected to be worth $1,030,077 after 20 years.
Cash Flow and Paying Down the Mortgage Over 20 Years
I started this investment with $140,000 out of pocket: a $125,000 (25%) down payment and $15,000 (3%) for closing costs (including financing and preparing the house for rent). The rent is expected to cover all the operating costs, including the mortgage principal and interest, and still give me positive net cash flow - even with the current, relatively high, 30yr fixed interest rate. Over the 20 years I held it, I expected this to result in $42,427 in positive cash flow and $171,511 in mortgage principal reduction (more equity for me). That adds up to $213,938 in total income generated.
HOW I AVOID TAX ON RENTAL INCOME
The value growth of the house - calculated as $1,030,077 - ($500,000 + $15,000) = $515,077 - isn't taxed yet because I haven't sold it (we'll get to that later!).
However, that $213,938 in income I generated is generally taxable. The good news is, I can often defer or avoid paying income tax on it by using a really powerful tax tool: asset value depreciation.
For tax purposes, the structure of the property (let’s assume ~80% of the total value, with the other 20% being the land) can be "written off" over 27.5 years. This lets me claim an annual non-cash "loss" of about $15,000 when filing my tax return every year.
Over the 20-year period, my total depreciation "loss" is $300,000. Since this $300,000 depreciation is more than my $213,938 net rental income, I don't owe any income tax on the rent money. The extra "loss" (about $86,000) can often be carried forward to offset other/future income.
OK, so I won’t be paying taxes for the rental income, but what about the appreciated value of the house?
TAXES WHEN I SELL: DEPRECIATION RECAPTURE
The tax bill usually comes due when I finally sell the property. If I sell the house after 20 years for $1,033,077, and assume a 10% cost of sale, my net sale proceeds would be around $930,000.
At this point, I get taxed on two main things:
Capital Gains (The increase in value): $930,000 (Net Proceeds) - $515,000 (Adjusted Cost Basis) = $415,000
Depreciation Recapture (The $300,000 I previously claimed as a tax "loss"): $300,000
That is, I will be taxed on a hefty $715,000. A big tax liability,
MY STRATEGIES FOR DELAYING OR AVOIDING CAPITAL GAINS AND DEPRECIATION RECAPTURE TAXES
Luckily, we have three main ways to handle this big tax liability:
I. Just Keep It and Refinance (Cash-Out Refi)
Instead of selling and paying substantial transaction costs and taxes, I can just hold onto my appreciating asset and keep benefiting from those sweet depreciation deductions. A cash-out refinance lets me borrow against my accumulated equity tax-free. For example, a lender would usually let me take a loan up to 70% of the $1,030,077 property value (about $720,000). After paying off my existing $203,489 mortgage balance, I could walk away with roughly $515,000 in tax-free cash (while keeping ~$310,000 in home principal!). My rental income would then cover the payments on the new, bigger mortgage.
Worth noting that Refinancing is significantly less stressful than selling because it eliminates the concern of market timing. Furthermore, I retain the option to refinance again should market rates become more favorable.
II. Sell and Buy Something Else (1031 Exchange)
If I do decide to sell the property, I can defer both the capital gains and depreciation recapture taxes by immediately reinvesting all the proceeds into buying another property of equal or greater value. This move, called a 1031 exchange (or like-kind exchange), basically shifts the tax bill to the new property, potentially forever. It also lets me start a brand new 27.5-year depreciation schedule for the increased property value.
III. Hold It Until Death (Step-Up in Basis)
This is a bit somber, but under the US tax code, if I hold the property until my death, my heirs inherit the asset at its current Fair Market Value. This "step-up in basis" essentially resets the clock on depreciation and completely wipes out all capital gains tax liability on the appreciation and depreciation recapture that built up during my lifetime. This feature is a key reason why real estate is considered awesome for passing down wealth across generations.
HOW I PUT THIS TOGETHER
My smart general plan is to use depreciation to offset taxes on rental income and a Refinance to get access to equity growth without triggering a taxable event. If I have to sell, I'll execute a 1031 exchange to defer the taxes. And if I hold the asset for the very long term, my heirs can ultimately sell it using the step-up in basis rule, potentially avoiding the tax bill entirely.
These aren’t tax tricks - they’re powerful tools for anyone willing to play the long game.
Want to talk through what this means for your situation?
I write these posts because I believe the more you understand the mechanics, the better decisions you make. If something here sparked a question - or made you wonder whether now might be the right time to start - I'm happy to think through it with you.
The intro call is free, 20 minutes, and there's no pitch. Just a conversation.
Or reach out directly: yossi@mylongterm.com | WhatsApp: +1 (650) 658-1010
S&P 500 vS. RENTAL PROPERTY: THE MATH BEHIND A BALANCED 20-YEAR STRATEGY
Investing in an S&P 500 index fund is a gold-standard strategy, but how does it truly stack up against long-term real estate rental property?
Investing in an S&P 500 index fund is a gold-standard strategy, but how does it truly stack up against long-term real estate?
I’m not here to talk you out of the S&P 500, I invest in it myself. Instead, I want to pull back the curtain on how to calculate real estate returns and explain why I believe real estate is another great avenue for building long term wealth.
THE BENCHMARK: S&P 500 PERFORMANCE (20-YEAR WINDOWS)
The S&P 500 is the ultimate "set it and forget it" tool. Looking at rolling 20-year windows between 1980 and 2025:
Average Annual Return: 9.83%
Worst 20-Year Window: 5.57% (1998–2017)
Best 20-Year Window: 15.54% (1980–1999)
At the average return, $1,000 becomes $6,520 in 20 years. It’s clean, efficient, and beats the average 2.62% inflation rate handsomely.
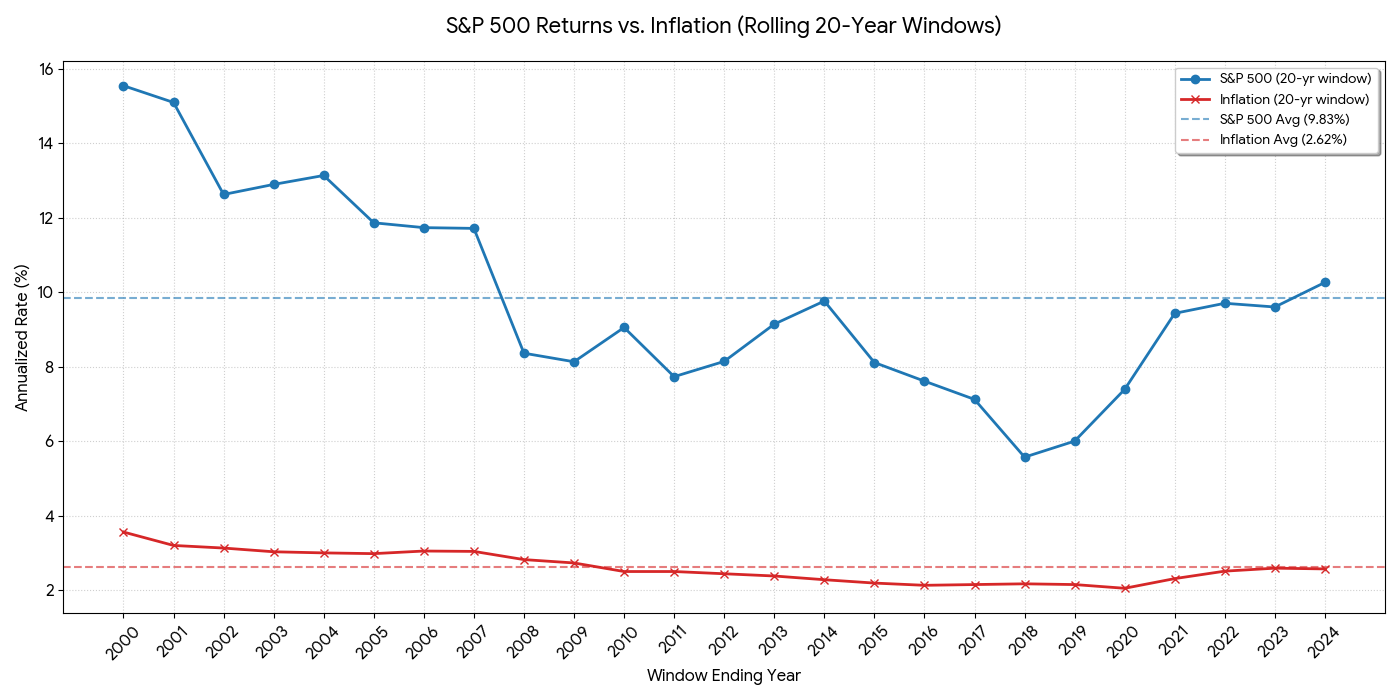
Comparing 20-Year Rolling Window Average Annual Growth of S&P 500 US Index Fund vs the US Inflation During the Same Periods.
* S&P 500 Annual Return Data: https://pages.stern.nyu.edu/~adamodar/New_Home_Page/datafile/histretSP.html
* US Annual Inflation Data: https://www.investopedia.com/inflation-rate-by-year-7253832
THE “ENGINE” OF REAL ESTATE: BREAKING DOWN THE ASSUMPTIONS
Assessing real estate is more complex because your return doesn't just come from a price ticker - it functions as a business model. I’ve built a conservative model backed by historical data that assumes current market conditions (including today's high interest rates).
Below is a simplified breakdown of the model assumptions. It includes several numbers, but please bear with me - it’s a great crash course in the mechanics of real estate.
1. The Entry ($140,000 Total Capital)
Purchase Price: $500,000 - Standardizing near the US median.
Down Payment: $125,000 - 25% for an investment loan.
Closing & Prep: $15,000 - 3% for mortgage fees and making the home "rent-ready".
2. The Income Stream (The Passive Engine)
Rent-to-Value ratio: 6.75% ($2,812/mo). This is also known as the “Gross Yield”. Yes, many investors look for houses at the 8-12% Gross Yield range, my model assumes more conservative/stable areas.
Vacancy: 6%. Assumes the house sits empty for 1.5 months every two years. Historically I see lower vacancy for my properties.
Property Value Growth: 3.68%. This is the 20-year window average for the areas I’m considering, lower than the national average of 3.92%.
Rent Growth: 2.94% annual increase. Rent historically grew at 83-88% of the value rate, I’m assuming 80% for the purpose of this model (3.68%*80%=2.94%).
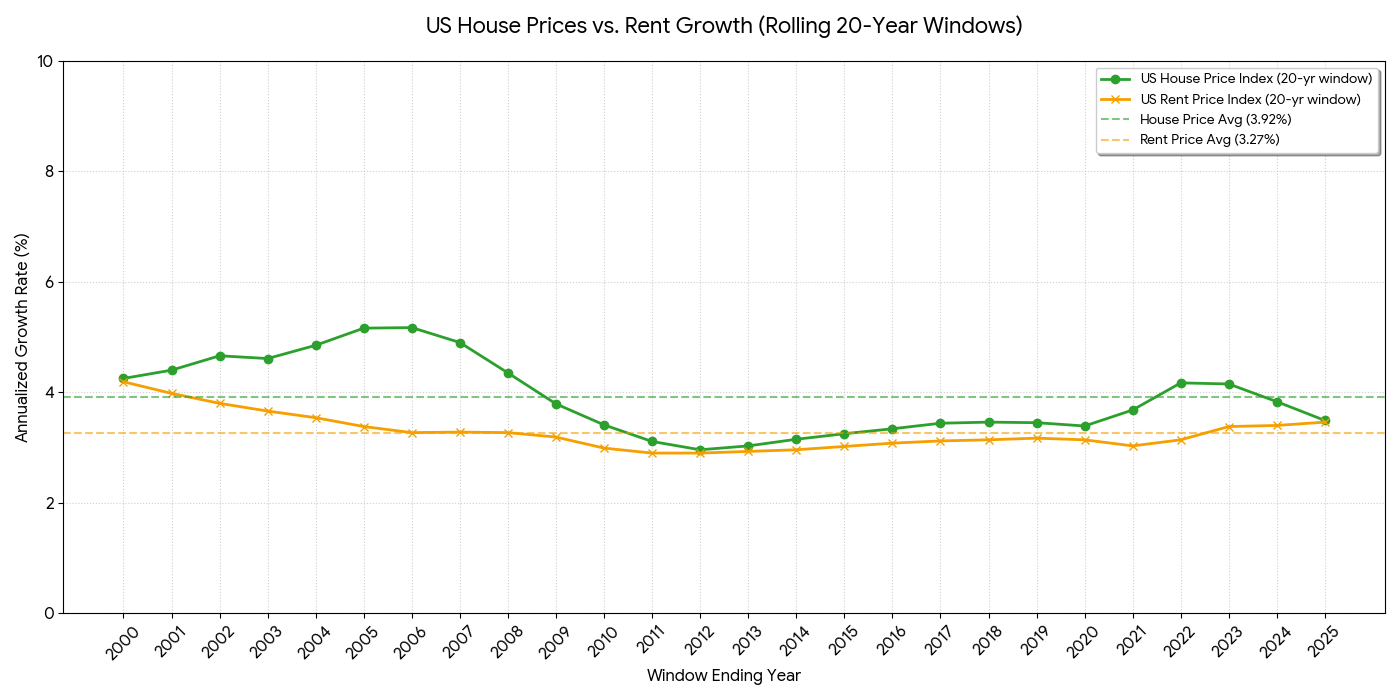
Tracking 20-Year Rolling Window Average Annual Growth of US House Prices & US House Rental Prices.
* US Housing Price Index: https://fred.stlouisfed.org/series/USSTHPI
* US House Rental Price Index: https://fred.stlouisfed.org/series/CUUR0000SEHA#0
3. The Expenses (Where the Money Goes)
Mortgage (P&I): $2,310/mo (6.25% fixed). The magic: This cost stays flat while your income climbs.
Management & Maintenance: 18% of gross rent (covers property manager, repairs, HOA, and LLC fees). This data vary by location and property management providers. These numbers reflect what I’ve seen over the years for my properties.
Taxes & Insurance: 0.8% of property value ($333/mo) - I usually choose areas with lower property taxes.
TOTAL WEALTH GENERATED: THE 20-YEAR RESULT
When we apply these updated growth rates over a 20-year horizon, we see the multiplier effect on your capital. While your initial out-of-pocket was $140,000, we track the growth relative to your $125,000 initial equity:
Future House Value: $1,030,077 (Initial $500k purchase + $530,077, at 3.68% annual appreciation).
Remaining Loan Balance: $203,489 (rent income from your tenant paid for your $170k debt+interest).
Total Investment Value: $868,985 (This includes your $125k initial principal, rental gains, and market appreciation).
Net Value Generated: $728,985(Total investment value minus your $140k entry cost. This is the “extra” money you created!).
MOIC (Multiple of Invested Capital):x6.21
IRR (Internal Rate of Return): 9.62%
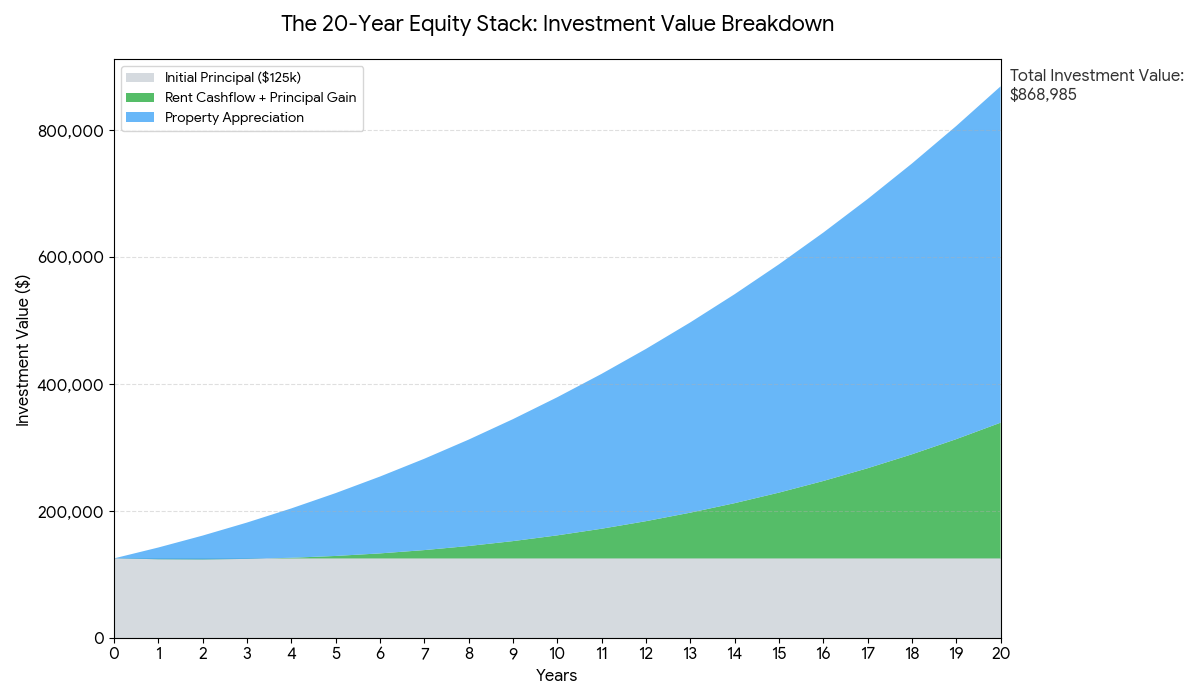
Real Estate Investment Value over 20-Year Window
* $500K Single Family House, $125K Down Payment, 30yr Fixed Rate Loan w/ 6.25% Interest, 3.68%/yr Property Value Increase, 6.75% Initial Rent, 2.94% Rent Value Increase @6% Vacancy, Including projected Property Taxes, Insurance, Property Management, Maintenance, LLC Management & HOA Expenses
SENSITIVITY ANALYSIS: MOVING THE LEVERS
The 9.62% IRR is our baseline, but real estate returns are sensitive to how the market moves. Here is how that return changes under different "what-if" scenarios:
The Optimized Case: If you refinance from 6.25% to 5% interest and maintain a lower 4% vacancy, your IRR climbs to 11.32%.
The Growth Case: If the area sees 5.38% appreciation (a historical high for this area) combined with that 5% interest rate, your IRR jumps to 14.59%.
The Recession Case: If vacancy hits 8%,appreciation slows to 2.79% (a historical low for stable areas) and original 6.25% loan is kept, and you had an unexpected expense of $15,000 at some point, your IRR is "reduced" to 7.12%.
Even in the "Recession Case," the real estate return (7.12%) remains higher than the S&P 500's worst 20-year window (@5.57%), illustrating the stability of this asset class.
The Takeaway: Real estate’s "worst-case" scenario since 1980 still outperformed the S&P 500’s "worst-case" scenario by 1.55%.
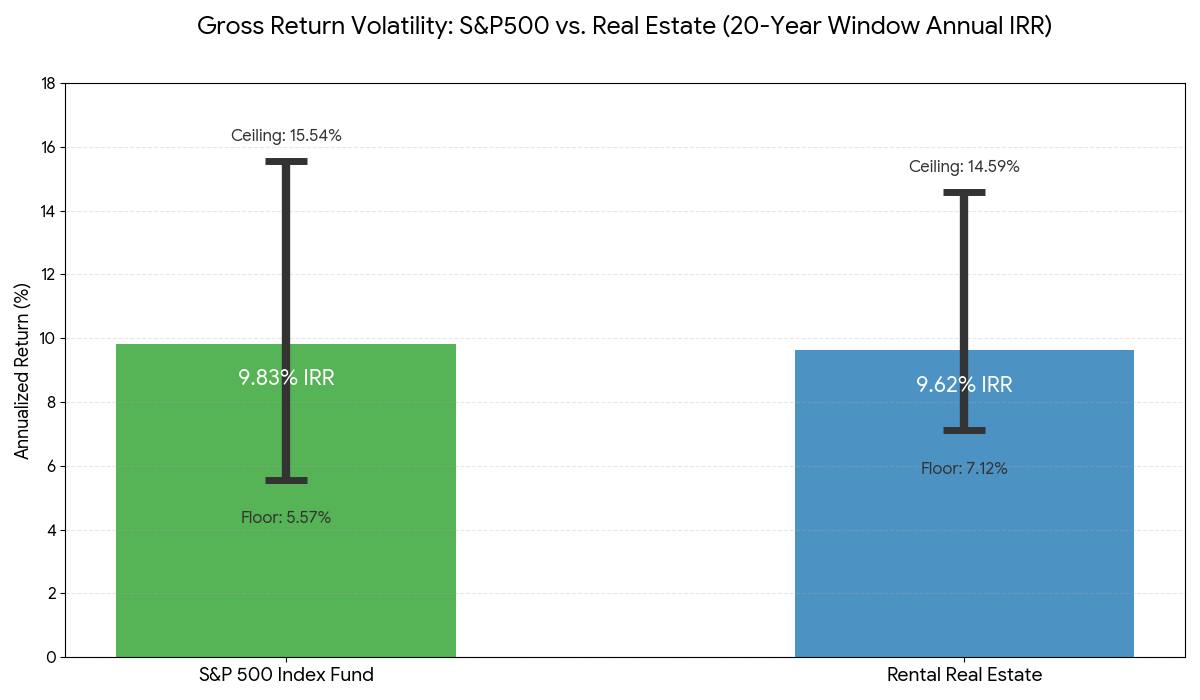
The 20-Year Window Annual IRR - Volatility Comparison (1980-2025):
* S&P 500: 9.83% Average IRR - Between 5.57% Floor to 15.54% Ceiling.
* Single Family Real Estate Rental: 9.62% expected IRR - Between 7.12% Floor and 14.59% Ceiling.
WHY REAL ESTATE IS A GENERATIONAL WEALTH BUILDER
While the S&P 500 return is slightly higher on average, real estate offers unique structural advantages that "pure" paper assets don't:
Principal Paydown: Your tenant is essentially funding a massive savings account for you. After 20 years, your $375k loan is whittled down to ~$203k - paid for by someone else.
Tax Efficiency: You can "write off" the value of the building (depreciation) against your rental income, often paying $0 in taxes on that monthly cash flow throughout 20+ years.
The "Step-Up" Legacy: If you pass a property to your heirs, the "cost basis" resets to the current market value. This can effectively help you avoid the “Recapture Tax”, wiping out 20+ years of capital gains taxes & depreciation for the next generation.
Responsible Illiquidity: You can’t panic-sell a house during a 10% market correction. This "forced discipline" is often the reason real estate investors actually reach the finish line while stock investors "hop out" at the wrong time. It also means that you don’t need to reduce your exposure to the volatile asset as you get older.
SUMAMRY: S&P 500 VS. REAL ESTATE AT A GLANCE
| Feature | S&P 500 ("Liquid Growth") | Real Estate ("Generational Play") |
|---|---|---|
| Effort Level | 100% Passive | Semi-Passive (Requires oversight) |
| Liquidity | High (Sell in seconds) | Medium (Months to liquidate, Stay the course) |
| Historical Floor | 5.57% (Higher volatility, Reduce exposure as you age) | 7.12% (Lower vulnerability) |
| Tax Efficiency | Standard Capital Gains | High (Depreciation & Step-up) |
| Access to Value | Sell (Time the market) | Refinance (Keep the asset) |
| Investor Mindset | "Extract value from capital" | "Build a long term foundation" |
THE BOTTOM LINE: WHY I DO BOTH
I don't believe in choosing "one or the other." Real estate should not be your only investment. Keeping liquid assets for a rainy day is non-negotiable - illiquidity is simply a risk you cannot ignore.
It’s also important to be honest: real estate isn’t truly passive. It takes work. However, it is an incredible vehicle for those playing the long game, it is an unparalleled wealth-building vehicle.
While the S&P 500 is an efficient way to grow your liquid assets with zero effort, Real Estate is the long term, structural play for building generational wealth. It allows you to:
Insulate against Volatility: Benefit from a significantly higher historical "floor" during market dips.
Optimize for Taxes: Keep more of your income through depreciation and provide your heirs a "stepped-up" inheritance.
Access Value Without Selling: Use refinancing to pull capital out of the asset rather than being forced to liquidate it.
I do both because I want the liquidity of the market and the structural power of real estate.
One provides growth for today; the other builds a foundation for generations.
Want to talk through what this means for your situation?
I write these posts because I believe the more you understand the mechanics, the better decisions you make. If something here sparked a question - or made you wonder whether now might be the right time to start - I'm happy to think through it with you.
The intro call is free, 20 minutes, and there's no pitch. Just a conversation.
Or reach out directly: yossi@mylongterm.com | WhatsApp: +1 (650) 658-1010
THE 3.92% GOLD STANDARD: ARE INVESTORS REALLY PRICING YOU OUT?
There is a loud narrative in America today: institutional investors are buying up the "American Dream" and driving home prices beyond the reach of families (or consumer home buyers), causing a US housing affordability crisis. But when you look at the historical data, the reality is much more nuanced - and perhaps more optimistic for individual buyers.
There is a loud narrative in America today: institutional investors are buying up the "American Dream" and driving home prices beyond the reach of families (or consumer home buyers), causing a US housing affordability crisis. But when you look at the historical data, the reality is much more nuanced - and perhaps more optimistic for individual buyers.
1. THE INVESTOR “BOOGEYMAN” VS. REALITY
Despite the headlines, large institutional investors aren't a new "invading force". Historically, investors (both small and large institutes) represent 18 - 24% of home purchases. We have seen a recent uptick in these numbers, with investor share climbing toward 30% in the past year, up from a stable 18.5% between 2020 and 2023.
However, it is important to look at the context: this increase is happening within a significantly smaller "pie". Total home sales have dropped to roughly 4 million in the past year - a sharp dip from the 6 million+ annual pace during the pandemic and the 5 million average in the years prior.
And here's the part that gets lost in the headlines: it isn't Wall Street doing the buying. Small "mom-and-pop" investors - those owning 10 or fewer properties - now drive more than 60% of all investor purchases, up from about 50% just a few years ago. Large institutional investors (the kind owning 1,000+ homes) make up only around 2% of all investor-owned homes nationally, and their footprint has actually been shrinking - institutional buying peaked in 2021 and had fallen roughly 65% by 2025.
So even the "investor" share of the market is mostly regular people - retirees, small landlords, families building a nest egg - not faceless corporations.
My read is that today’s challenging environment of higher interest rates has sidelined many traditional buyers. We can see this clearly in the cash purchase rate: as mortgage rates spiked, the share of homes bought with all-cash (vs. financed) surged to 32 - 35% between 2023 and 2024. This "cash-is-king" environment naturally favored investors and wealthy buyers. But the market is finally starting to ease. In the past quarter, the cash purchase rate dipped back down to ~30%. While still higher than the 27.5% pre-pandemic average, it is a signal that the market is starting to reopen for traditional homeowners.
This shift suggests that the recent investor dominance was a result of a constrained environment, not a permanent takeover. While this "shrinking pie" isn't great for the non-investor community in the short term, it is likely a temporal shift. Even with this recent volatility, the vast majority of home sales - and the decades of historical data that follow - remain dominated by homeowners.
OK, so most of the historical US house sales data is dominated by non-investors. Let's assess the data more closely and see if we can draw some useful learnings about home value growth:
2. THE “GOLD STANDARD” OF REAL ESTATE RETURN
The US Single Family home is a quite a sizable market, with 85 million houses. When we look at the historical sales data, we can see that ~5 million single-family homes are sold in the US every year , 85% of which are existing home resales. This means we have a huge amount of historical data (5M records per year!), and this data set mostly represents how existing home value holds.
The consistency of the US housing market is staggering. Since World War II, prices have only dropped year-over-year in 7 of the last 70 years, in went up year-over-year in the remaining 63 years (90%). To find the "truth" for a long-term investor, I analyzed a 20-year rolling window of theFederal Reserve's House Price Index from 1980 to 2024. By “20-year rolling window”, I mean - looking at the annual value increase between 1980 - 1999, 1981 - 2000, 1982 - 2001, etc.
The Findings:
Average Annual ROI: The average annual value growth of these 20-year windows is 3.92%. I call this the Gold Standard for long-term planning.
The Floor: Even the "worst" 20-year period (1993–2012), which included the subprime crisis, yielded a positive 2.92% annual return.
The Ceiling: The highest 20-year window reached 5.17% annual growth (the 1987–2006 window, right before the crash).
At the end of the day, a 3.92% average annual growth is a remarkably consistent anchor for long-term wealth - especially when you consider it’s just the "top-line" value. When you layer on rental income, tax benefits, and the power of leverage, that return begins to look much more like 9 - 10% (a math deep-dive I’ll save for a future post).
But even with a "Gold Standard" in hand, a bigger question remains: Why? What is actually pushing these prices up decade after decade, and is it sustainable?
3. THE GROWTH GAP: WHY SLOWING POPULATION DOESN’T MEAN SLOWING PRICES
I went into this research with a fear. My intuition was that house price growth should correlate directly with population growth - the simple logic being, "the more people we have, the more houses we need". But as I looked at the data, the reality of the US population trend was anything but promising.
This led me to a scary question: If house prices rely on population growth, and that growth is slowing to a crawl, is the housing market destined to collapse?
The surprising answer is no. There is almost zero correlation between population growth trends and house price appreciation. While population growth has trended down since the 90s (from ~1.4% to <0.80%), house prices have continued their steady climb.
So, what does it correlate with? GDP.
The Correlation: House prices track the growth of the US economy (Gross Domestic Product). As we produce more value as a nation, that wealth is captured in our land. Between 1980 and 2024, US GDP grew almost every year, and even more consistency when looking at the 20-year windows, averaging a 4.95% annual growth for 20-year window - and very much aligned with the steady climb of real estate.
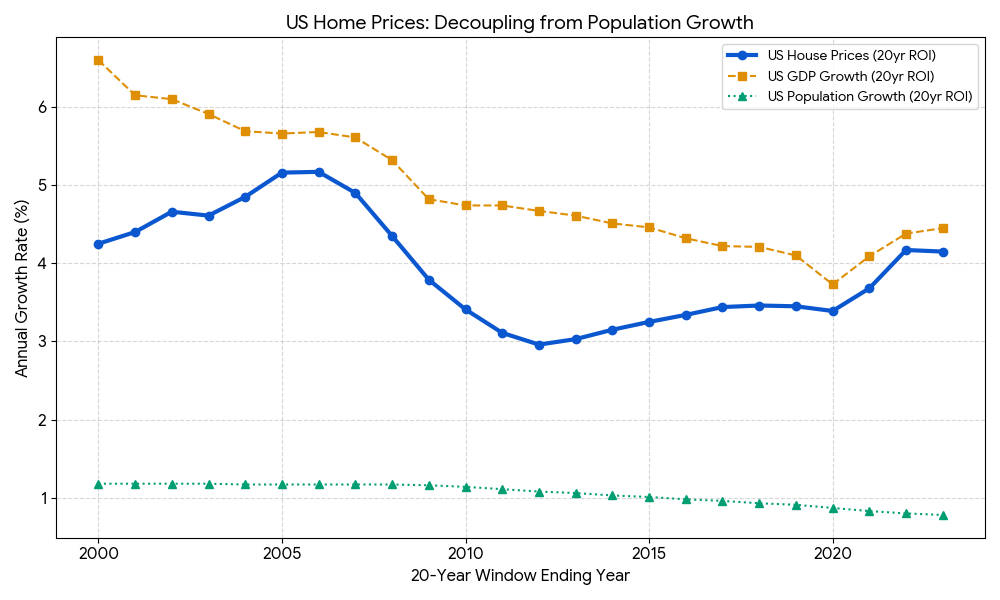
Annual ROI of 20yr window: US Home Prices vs US Population vs US GDP
What to look for in this graph: Notice how the green line (Population) is sliding toward zero, while the thick blue line (House Prices) stays tethered to the orange line (GDP). This visually proves that as long as the American economy produces more value, home prices have a foundation to rise, regardless of how many people are in the country.
Given the historical link between US economic growth and real estate appreciation, it is a safe assumption that real estate values will continue to rise as long as the US economy maintains its growth trajectory.
4. THE ”STEP-UP” SECRET: WHY SUPPLY STAYS LOW
Market liquidity is another factor maintaining the resilience of prices. A key reason for high prices is the Step-Up in Basis rule, which enables heirs to inherit a property at its present market value. This effectively eliminates the capital gains tax liability on the appreciation that occurred during the parents' ownership.
This creates a powerful incentive for older generations to hold onto their assets. Instead of downsizing, many homeowners stay in their family homes to protect that tax-free wealth transfer for their children. While this reduces the supply of homes for young families, it has been a cornerstone of how America builds and keeps wealth since 1921.
THE BOTTOM LINE
I realized I can’t change the tax code or stop the slow-down of population growth. But I can help people understand these "rules of the game".
Real estate isn't going up because of a few big investors; it’s going up because the US economy is growing and our tax laws reward long-term ownership.
I expect that the market is going to move upward with or without institutional investors.
The best way to fight back against the "wealth gap" is to get on the scoreboard.
References:
US House Price Index: https://fred.stlouisfed.org/series/USSTHPI
US Population Growth Rate: https://www.macrotrends.net/global-metrics/countries/usa/united-states/population-growth-rate
US GDP: https://www.macrotrends.net/global-metrics/countries/usa/united-states/gdp-gross-domestic-product
Investor owned homes: https://nationalmortgageprofessional.com/news/small-investors-dominate-single-family-home-market
Cash purchase rate: https://fred.stlouisfed.org/series/HSTFC
Realtor.com / mom-and-pop investor share: https://www.scotsmanguide.com/news/mom-and-pop-landlords-drive-investor-housing-market/
BatchData Q2 2025 Investor Pulse Report (institutional vs. small investor ownership breakdown): https://www.prnewswire.com/news-releases/real-estate-investors-account-for-33-of-q2-2025-home-purchases-according-to-q2-2025-investor-pulse-report-from-batchdata-302567135.html
Want to talk through what this means for your situation?
I write these posts because I believe the more you understand the mechanics, the better decisions you make. If something here sparked a question - or made you wonder whether now might be the right time to start - I'm happy to think through it with you.
The intro call is free, 20 minutes, and there's no pitch. Just a conversation.
Or reach out directly: yossi@mylongterm.com | WhatsApp: +1 (650) 658-1010