
MY INVESTMENT - KNOXVILLE, TN
A 4-BED FAMILY HOME IN KNOXVILLE, TN - BOUGHT IN 2018, STILL HELD TODAY.
This is one of my own personal investments. I'm sharing the full numbers - the good years and the slow ones - because I think transparency is more useful than a highlight reel.
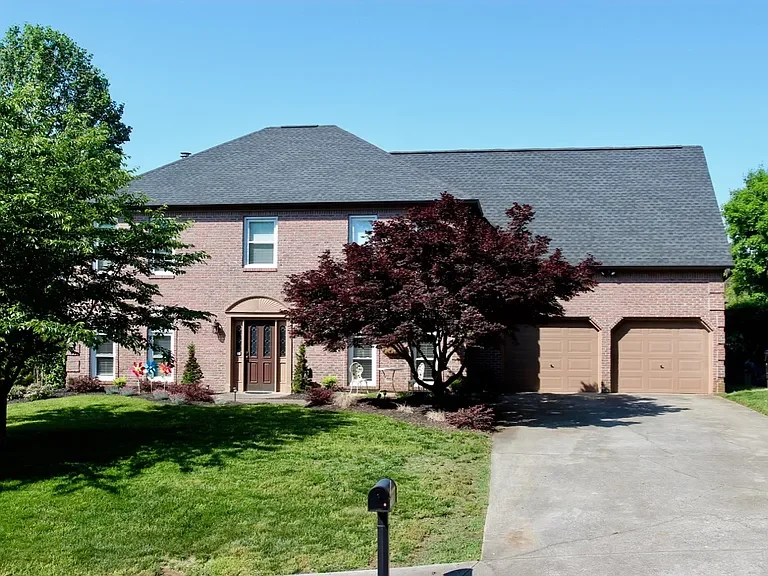
In late 2018, I acquired a ~3,100 sq. ft., 4-bedroom, 3-bathroom single-family home in Knoxville, TN (zip 37922). It took a few months to find the right tenant, who moved in early 2019 at $2,100/month. By 2024, that rent had grown to $2,800/month - a 4.9% annual increase.
Estimated 20% IRR / x3.68 MOIC since purchase - using the same conservative playbook I use with my clients.
WHY THIS MARKET
WHY KNOXVILLE? THREE REASONS.
Educated, stable tenants - The area benefits from a well-educated population, driven by the University of Tennessee and Oak Ridge National Laboratory, as well as strong public schools. This attracts community-oriented tenants who maintain properties well and tend to stay longer.
A conservative, low-volatility market - Knoxville's real estate market barely flinched during the 2008/09 subprime crisis. Rent yields consistently exceed 6%, and property taxes sit below 0.5% - a rare combination that makes long-term passive income genuinely reliable.
Local expertise I've built over time - This is my second investment property in Knox County. That familiarity with the local market, and the network of trusted service providers I've built here, is part of what makes the numbers work.
(1) RENTAL INCOME STORY
Cash flow was negative in the first year - that's normal with vacancy. By 2019 it turned positive and stayed that way, with two tenant turnovers that actually allowed rent to adjust to market rate.
Total Rent Cashflow (2018-2024): $22,000
Accumulated Principal Payments (2018-2024): $29,000
Total Rental P&L Value: $51,000
While the general policy prioritizes rental stability for existing tenants, two instances of turnover occurred during this period, facilitating market-rate adjustments and a substantial increase in rental revenue:
Rent: $2,100/month (2018) to $2,800/month (2024)
Annual Rent Increase (CAGR): 4.9%
(2) WHAT THE PROPERTY IS WORTH TODAY
I modeled 3.6% annual appreciation when I bought this. The market delivered 8.9% - largely due to post-COVID demand. But here's what I want to highlight: even at my original conservative projection, this was still a strong investment.
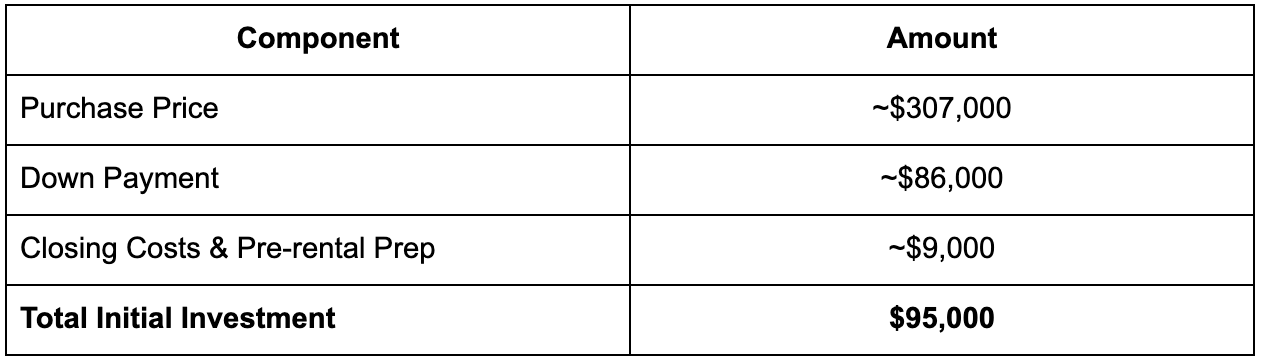
Purchase Price (2018): $307,000
Estimated Value (Zillow, Late 2024): ~$560,000
Average Annual Appreciation (CAGR): ~8.9%
PUTTING THIS TOGETHER: 20% IRR OVER 6 YEARS.
Combining rental income and appreciation, this investment delivered an average annual IRR of 20% between 2018 and 2024. An initial investment of $95,000 grew to an estimated value of ~$337,000.
And remember - this property hasn't been sold. The clock is still running.
WHAT IF THE MARKET HAD BEEN JUST… NORMAL?
The 20% IRR is real - but I don't want you to walk away thinking it depends on a once-in-a-generation market surge. Here's what the numbers look like using my original conservative projections:
Projected Appreciation: 3.6%/year (House Value: $386K in 2024)
Projected Rent Increase: 2.8%/year (Rent: $2,435/month in 2024)
A 9% IRR in a completely normal market. That's the conservative playbook - and that's what I build every investment around.
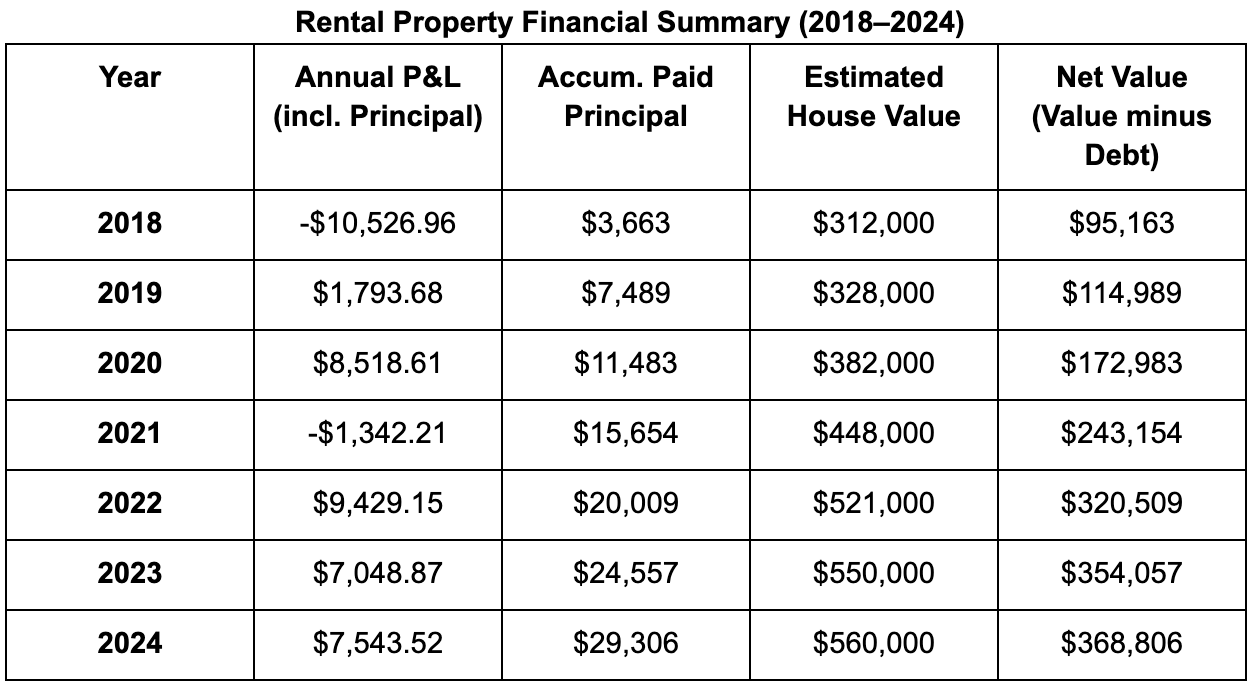
THE FULL PICTURE - YEAR BY YEAR
Here's every year, including the ones that were flat or negative. No editing.
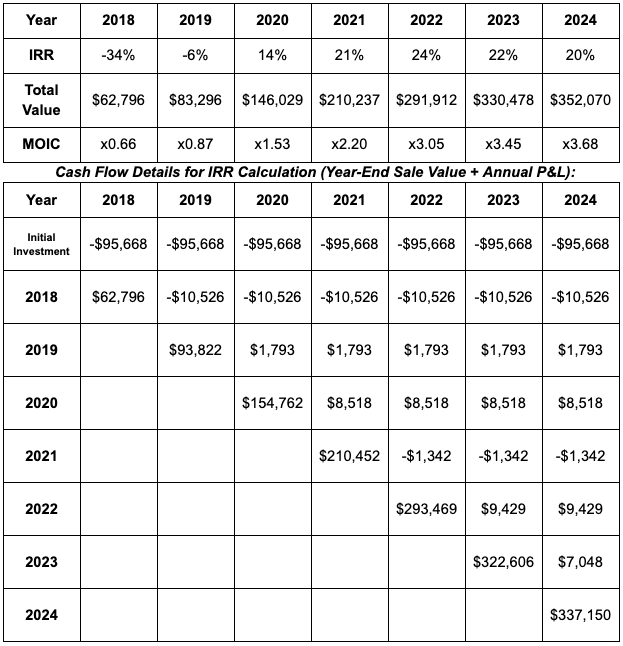
This table shows the IRR achieved if the property were sold at estimated value (minus cost of sale) at the end of each respective year, based on a constant initial investment of -$95,668:
THIS IS A PLAYBOOK I USE WITH EVERY CLIENT.
Conservative market selection. Long-term hold. Trusted local network. Full transparency on the numbers - including the slow years.
If you want to understand what this could look like for your situation, let’s talk.
→ See the North Las Vegas case study - a different market, a different story