
S&P 500 vS. RENTAL PROPERTY: THE MATH BEHIND A BALANCED 20-YEAR STRATEGY
Investing in an S&P 500 index fund is a gold-standard strategy, but how does it truly stack up against long-term real estate?
I’m not here to talk you out of the S&P 500, I invest in it myself. Instead, I want to pull back the curtain on how to calculate real estate returns and explain why I believe real estate is another great avenue for building long term wealth.
THE BENCHMARK: S&P 500 PERFORMANCE (20-YEAR WINDOWS)
The S&P 500 is the ultimate "set it and forget it" tool. Looking at rolling 20-year windows between 1980 and 2025:
Average Annual Return: 9.83%
Worst 20-Year Window: 5.57% (1998–2017)
Best 20-Year Window: 15.54% (1980–1999)
At the average return, $1,000 becomes $6,520 in 20 years. It’s clean, efficient, and beats the average 2.62% inflation rate handsomely.
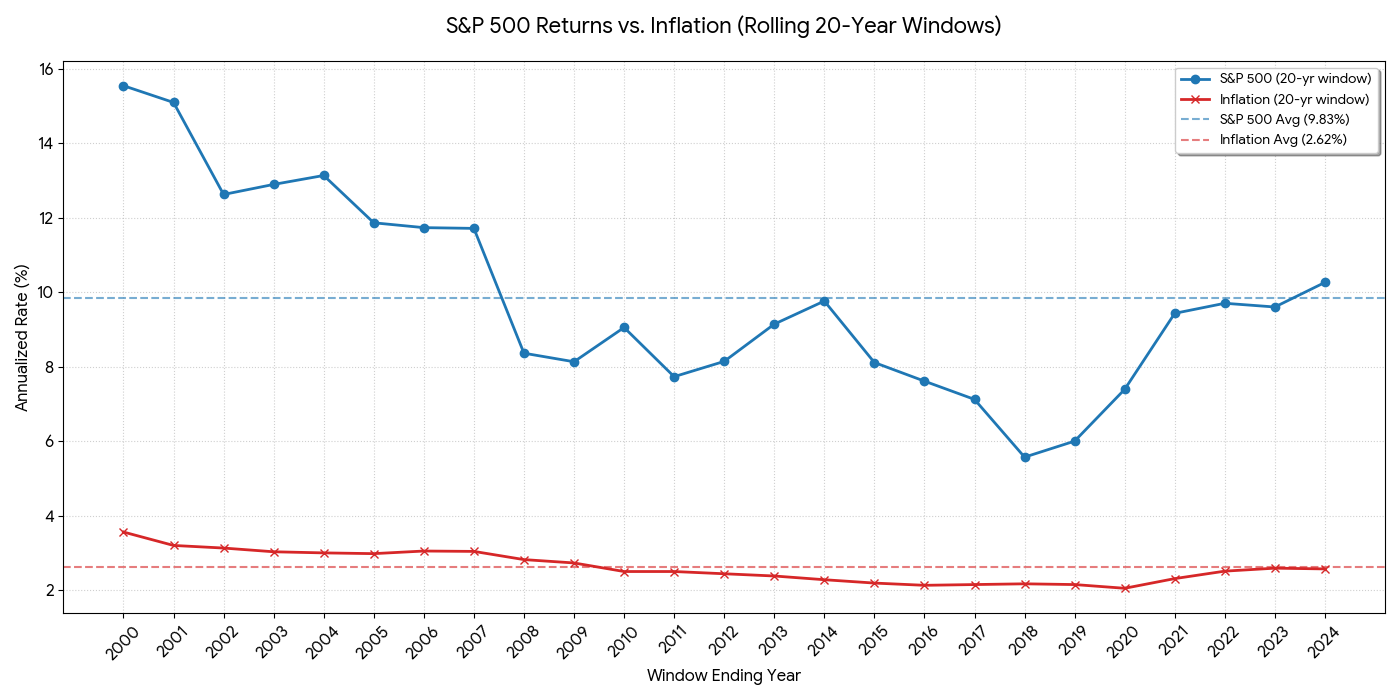
Comparing 20-Year Rolling Window Average Annual Growth of S&P 500 US Index Fund vs the US Inflation During the Same Periods.
* S&P 500 Annual Return Data: https://pages.stern.nyu.edu/~adamodar/New_Home_Page/datafile/histretSP.html
* US Annual Inflation Data: https://www.investopedia.com/inflation-rate-by-year-7253832
THE “ENGINE” OF REAL ESTATE: BREAKING DOWN THE ASSUMPTIONS
Assessing real estate is more complex because your return doesn't just come from a price ticker - it functions as a business model. I’ve built a conservative model backed by historical data that assumes current market conditions (including today's high interest rates).
Below is a simplified breakdown of the model assumptions. It includes several numbers, but please bear with me - it’s a great crash course in the mechanics of real estate.
1. The Entry ($140,000 Total Capital)
Purchase Price: $500,000 - Standardizing near the US median.
Down Payment: $125,000 - 25% for an investment loan.
Closing & Prep: $15,000 - 3% for mortgage fees and making the home "rent-ready".
2. The Income Stream (The Passive Engine)
Rent-to-Value ratio: 6.75% ($2,812/mo). This is also known as the “Gross Yield”. Yes, many investors look for houses at the 8-12% Gross Yield range, my model assumes more conservative/stable areas.
Vacancy: 6%. Assumes the house sits empty for 1.5 months every two years. Historically I see lower vacancy for my properties.
Property Value Growth: 3.68%. This is the 20-year window average for the areas I’m considering, lower than the national average of 3.92%.
Rent Growth: 2.94% annual increase. Rent historically grew at 83-88% of the value rate, I’m assuming 80% for the purpose of this model (3.68%*80%=2.94%).
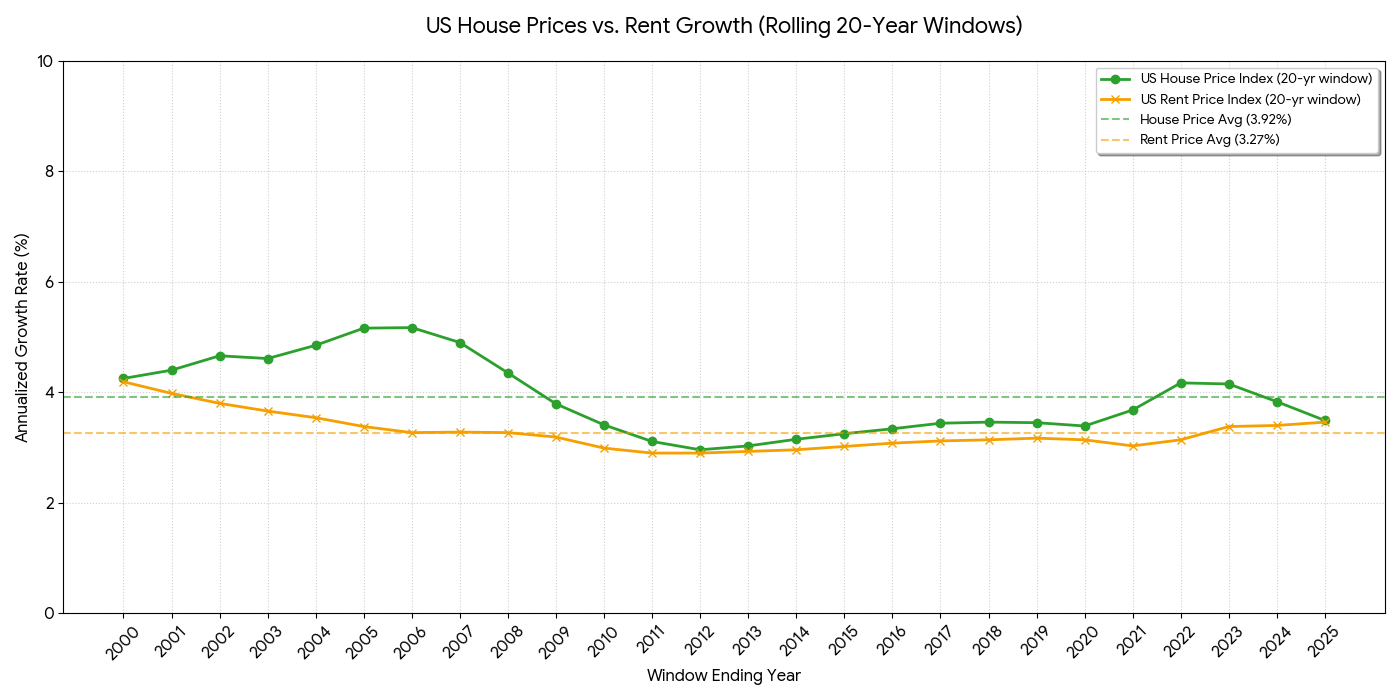
Tracking 20-Year Rolling Window Average Annual Growth of US House Prices & US House Rental Prices.
* US Housing Price Index: https://fred.stlouisfed.org/series/USSTHPI
* US House Rental Price Index: https://fred.stlouisfed.org/series/CUUR0000SEHA#0
3. The Expenses (Where the Money Goes)
Mortgage (P&I): $2,310/mo (6.25% fixed). The magic: This cost stays flat while your income climbs.
Management & Maintenance: 18% of gross rent (covers property manager, repairs, HOA, and LLC fees). This data vary by location and property management providers. These numbers reflect what I’ve seen over the years for my properties.
Taxes & Insurance: 0.8% of property value ($333/mo) - I usually choose areas with lower property taxes.
TOTAL WEALTH GENERATED: THE 20-YEAR RESULT
When we apply these updated growth rates over a 20-year horizon, we see the multiplier effect on your capital. While your initial out-of-pocket was $140,000, we track the growth relative to your $125,000 initial equity:
Future House Value: $1,030,077 (Initial $500k purchase + $530,077, at 3.68% annual appreciation).
Remaining Loan Balance: $203,489 (rent income from your tenant paid for your $170k debt+interest).
Total Investment Value: $868,985 (This includes your $125k initial principal, rental gains, and market appreciation).
Net Value Generated: $728,985(Total investment value minus your $140k entry cost. This is the “extra” money you created!).
MOIC (Multiple of Invested Capital):x6.21
IRR (Internal Rate of Return): 9.62%
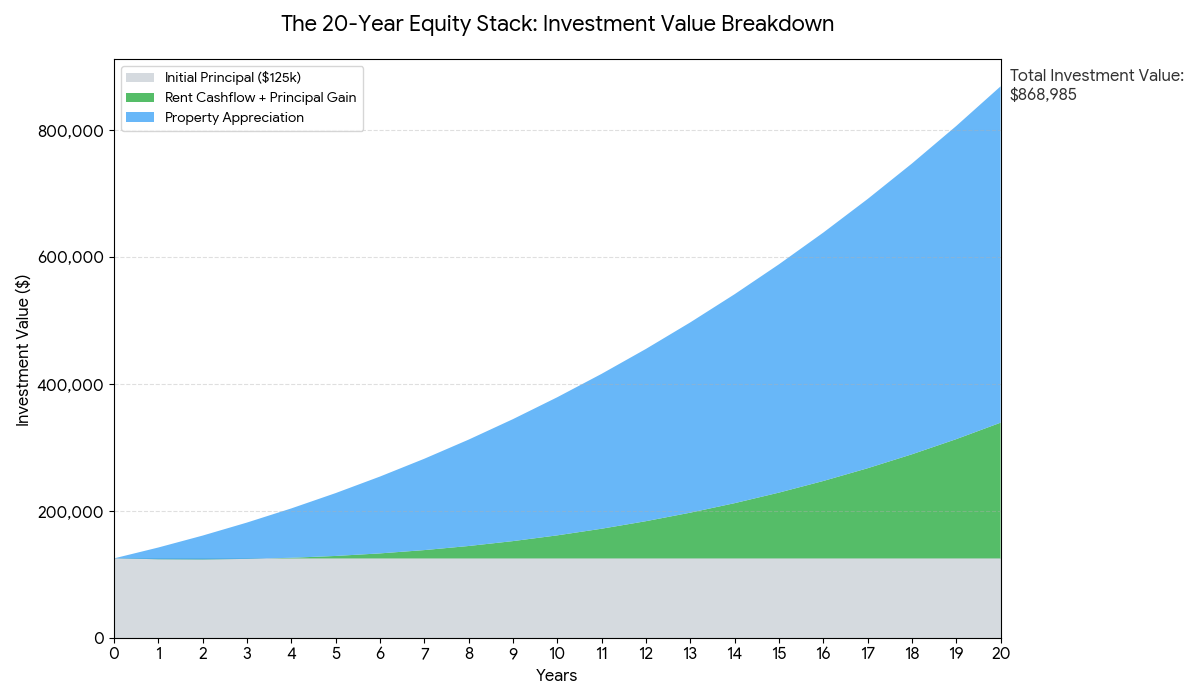
Real Estate Investment Value over 20-Year Window
* $500K Single Family House, $125K Down Payment, 30yr Fixed Rate Loan w/ 6.25% Interest, 3.68%/yr Property Value Increase, 6.75% Initial Rent, 2.94% Rent Value Increase @6% Vacancy, Including projected Property Taxes, Insurance, Property Management, Maintenance, LLC Management & HOA Expenses
SENSITIVITY ANALYSIS: MOVING THE LEVERS
The 9.62% IRR is our baseline, but real estate returns are sensitive to how the market moves. Here is how that return changes under different "what-if" scenarios:
The Optimized Case: If you refinance from 6.25% to 5% interest and maintain a lower 4% vacancy, your IRR climbs to 11.32%.
The Growth Case: If the area sees 5.38% appreciation (a historical high for this area) combined with that 5% interest rate, your IRR jumps to 14.59%.
The Recession Case: If vacancy hits 8%,appreciation slows to 2.79% (a historical low for stable areas) and original 6.25% loan is kept, and you had an unexpected expense of $15,000 at some point, your IRR is "reduced" to 7.12%.
Even in the "Recession Case," the real estate return (7.12%) remains higher than the S&P 500's worst 20-year window (@5.57%), illustrating the stability of this asset class.
The Takeaway: Real estate’s "worst-case" scenario since 1980 still outperformed the S&P 500’s "worst-case" scenario by 1.55%.
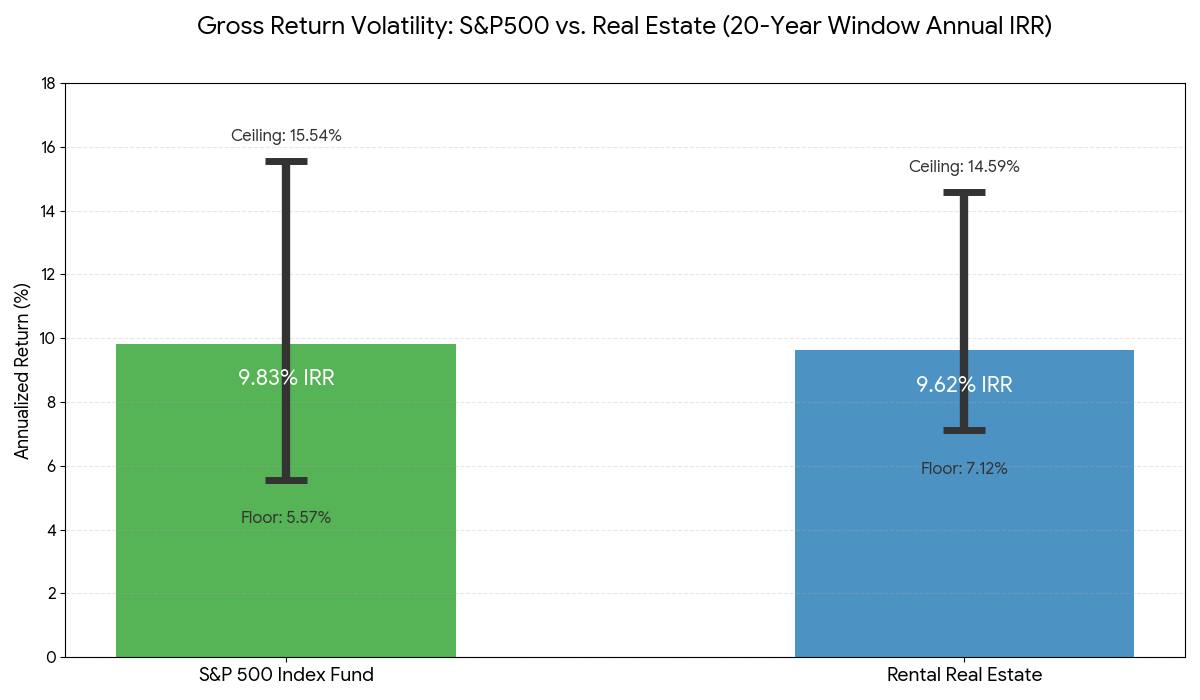
The 20-Year Window Annual IRR - Volatility Comparison (1980-2025):
* S&P 500: 9.83% Average IRR - Between 5.57% Floor to 15.54% Ceiling.
* Single Family Real Estate Rental: 9.62% expected IRR - Between 7.12% Floor and 14.59% Ceiling.
WHY REAL ESTATE IS A GENERATIONAL WEALTH BUILDER
While the S&P 500 return is slightly higher on average, real estate offers unique structural advantages that "pure" paper assets don't:
Principal Paydown: Your tenant is essentially funding a massive savings account for you. After 20 years, your $375k loan is whittled down to ~$203k - paid for by someone else.
Tax Efficiency: You can "write off" the value of the building (depreciation) against your rental income, often paying $0 in taxes on that monthly cash flow throughout 20+ years.
The "Step-Up" Legacy: If you pass a property to your heirs, the "cost basis" resets to the current market value. This can effectively help you avoid the “Recapture Tax”, wiping out 20+ years of capital gains taxes & depreciation for the next generation.
Responsible Illiquidity: You can’t panic-sell a house during a 10% market correction. This "forced discipline" is often the reason real estate investors actually reach the finish line while stock investors "hop out" at the wrong time. It also means that you don’t need to reduce your exposure to the volatile asset as you get older.
SUMAMRY: S&P 500 VS. REAL ESTATE AT A GLANCE
| Feature | S&P 500 ("Liquid Growth") | Real Estate ("Generational Play") |
|---|---|---|
| Effort Level | 100% Passive | Semi-Passive (Requires oversight) |
| Liquidity | High (Sell in seconds) | Medium (Months to liquidate, Stay the course) |
| Historical Floor | 5.57% (Higher volatility, Reduce exposure as you age) | 7.12% (Lower vulnerability) |
| Tax Efficiency | Standard Capital Gains | High (Depreciation & Step-up) |
| Access to Value | Sell (Time the market) | Refinance (Keep the asset) |
| Investor Mindset | "Extract value from capital" | "Build a long term foundation" |
THE BOTTOM LINE: WHY I DO BOTH
I don't believe in choosing "one or the other." Real estate should not be your only investment. Keeping liquid assets for a rainy day is non-negotiable - illiquidity is simply a risk you cannot ignore.
It’s also important to be honest: real estate isn’t truly passive. It takes work. However, it is an incredible vehicle for those playing the long game, it is an unparalleled wealth-building vehicle.
While the S&P 500 is an efficient way to grow your liquid assets with zero effort, Real Estate is the long term, structural play for building generational wealth. It allows you to:
Insulate against Volatility: Benefit from a significantly higher historical "floor" during market dips.
Optimize for Taxes: Keep more of your income through depreciation and provide your heirs a "stepped-up" inheritance.
Access Value Without Selling: Use refinancing to pull capital out of the asset rather than being forced to liquidate it.
I do both because I want the liquidity of the market and the structural power of real estate.
One provides growth for today; the other builds a foundation for generations.
Want to talk through what this means for your situation?
I write these posts because I believe the more you understand the mechanics, the better decisions you make. If something here sparked a question - or made you wonder whether now might be the right time to start - I'm happy to think through it with you.
The intro call is free, 20 minutes, and there's no pitch. Just a conversation.
Or reach out directly: yossi@mylongterm.com | WhatsApp: +1 (650) 658-1010