Investment Case:
The Post-Crisis Opportunity: Single Family in North Las Vegas - estimated 27% IRR / x13.37 MOIC since purchased
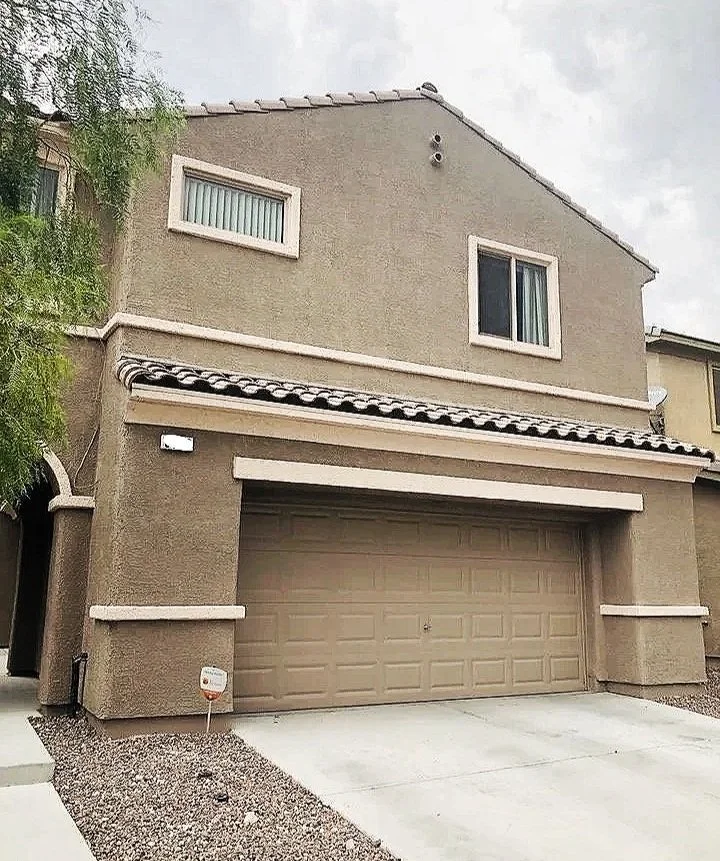
This is the story of seizing a unique opportunity in the aftermath of a major financial crisis. An acquisition of a 3-bedroom, 2-bathroom, 2,100 sq ft single-family home in North Las Vegas, NV (zip code 89084) back in 2012.
The Background: Turning Crisis into Opportunity
The subject property, constructed in 2006, reached an initial valuation of $340,000. Following the 2008–2009 subprime mortgage crisis, the local real estate market experienced significant contraction, resulting in a 65% depreciation of asset value. This volatility led to the abandonment of the asset by the original owner and a subsequent bank foreclosure.
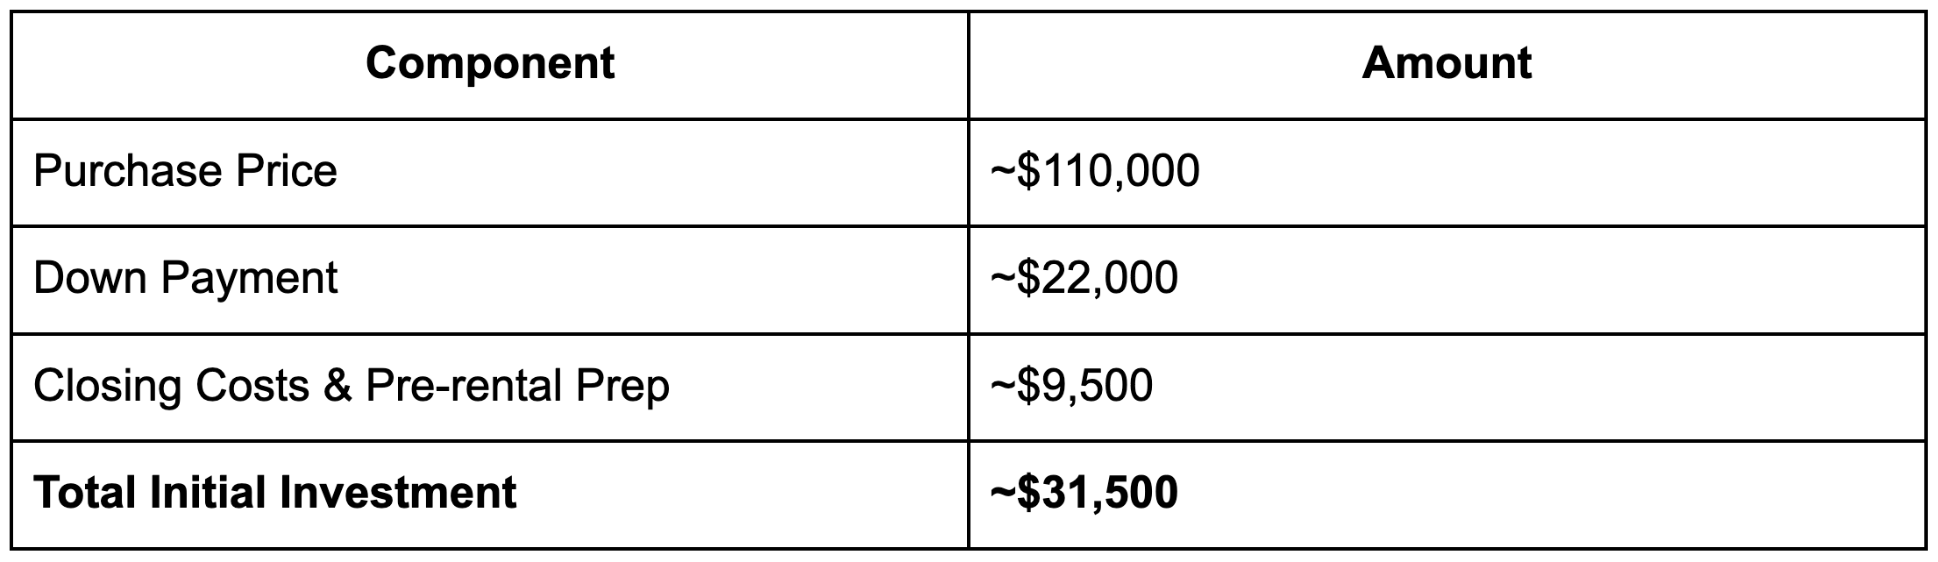
The property was acquired as a distressed asset for $110,000, representing a substantial discount from both the original purchase price and the cost of construction. This entry point allowed for a low-capital market entry, mitigating the financial risks associated with the high-leverage environment typical of new developments.
Initial Investment and Entry
Financing 80% of the purchase, made the cash outlay relatively small, minimizing the exposure risk in a recovering market.
The first tenant moved in shortly after, renting the house for $1,295/month. For the first six years, the rent remained fairly stable, which was expected during the slow post-crisis recovery. By 2024, the rent had steadily increased to $1,925.
Investment Performance (2012-2024): The Comeback Story
The investment's success is characterized by consistent rental yield and a significant recovery in market valuation following the 2012 acquisition.
1. Operational Performance and Rental Yield
With the exception of a single fiscal year (2014) - marked by a vacancy period and capital expenditures for appliance replacement following a security breach - the asset maintained a positive cash flow annually. The combination of fixed-rate mortgage obligations and upward-trending market rents resulted in a strengthening Profit & Loss (P&L) profile.
Total Rent Cashflow (2012-2024): $90,338
Accumulated Principal Payments (2018-2024): $23,044
Total Rental P&L Value: $113,382
Rental rates increased from a baseline of $1,295/month in 2012 to $1,925/month in 2024. This represents a Compound Annual Growth Rate (CAGR) of 3.7% in rental income, outpacing standard inflation hedges.
2. Market Rebound and Capital Appreciation
The timing of the acquisition during a period of market distress maximized the potential for capital gains. While the asset remains unrealized (unsold), current valuations indicate a substantial increase relative to the acquisition basis.
Purchase Price (2012): $110,000
Estimated Value (Late 2024): ~$425,000
Average Annual Appreciation (CAGR): ~11%
The initial investment hypothesis - projecting a full value recovery - was validated, though the timeline to parity extended to eight years, slightly beyond the original seven-year forecast.
3. Market Volatility Appreciation
Analysis of the long-term price trajectory reveals that the 2024 estimated value is only 18% higher than the original 2006 purchase price of $340,000.
This suggests that while the North Las Vegas submarket offers strong yield potential through rental income, the underlying asset value remains subject to high volatility, where significant appreciation is largely dependent on timing the market cycle correctly rather than linear growth.
The Overall Return: Leveraging Low Entry Cost
By combining the steady rental income with the massive appreciation driven by the subprime recovery, the investment yielded an exceptional average annual Internal Rate of Return (IRR) of 27% between 2012–2024.
Or, initial investment of ~$31,500 in 2012 turned to an estimated value of ~$343,000 in 2024.
And now to the more detailed analysis
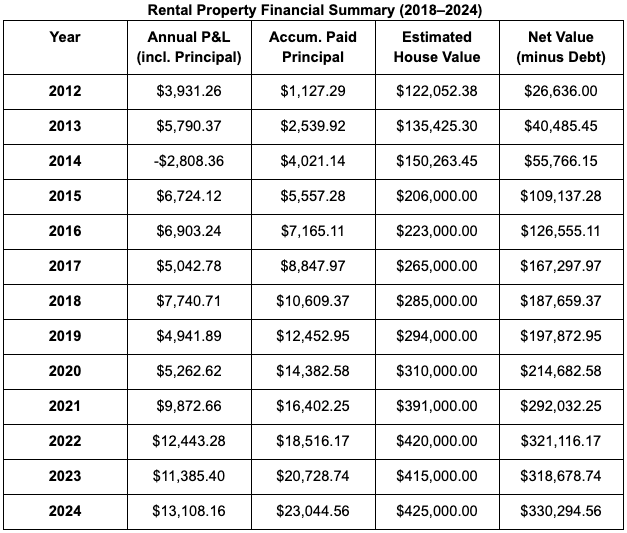
The financial performance and value growth of the rental property from 2012 to 2024 are summarized below, including both annual profitability and the cumulative Internal Rate of Return (IRR).
This table tracks the annual financial performance (including principal repayment) and the cumulative value of our equity in the property:
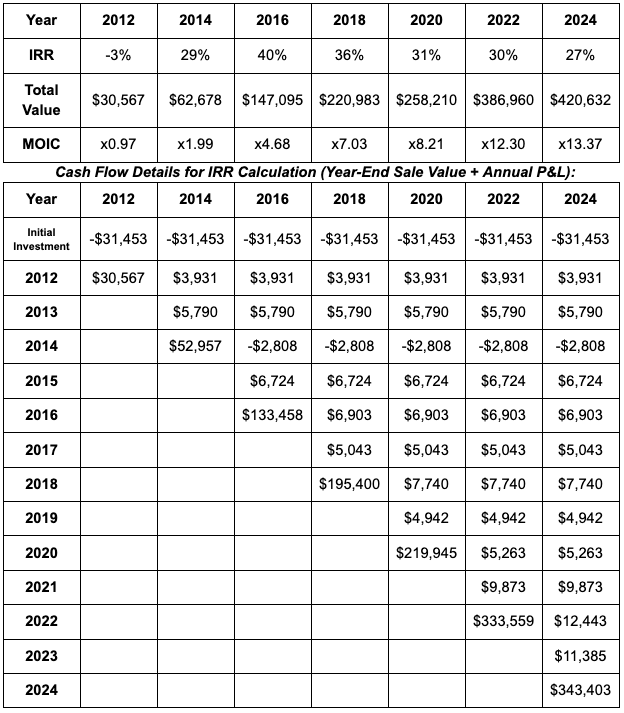
Internal Rate of Return (IRR) by Holding Period
This table shows the IRR achieved if the property were sold at estimated value (minus cost of sale) at the end of each respective year, based on a constant initial investment of -$31,453: